Resolution and Pixel Density: Choosing PPI for an Embedded HMI
Learn how to calculate display PPI and choose an embedded HMI resolution from viewing distance, touch size, graphics workload, interface bandwidth, and cost.
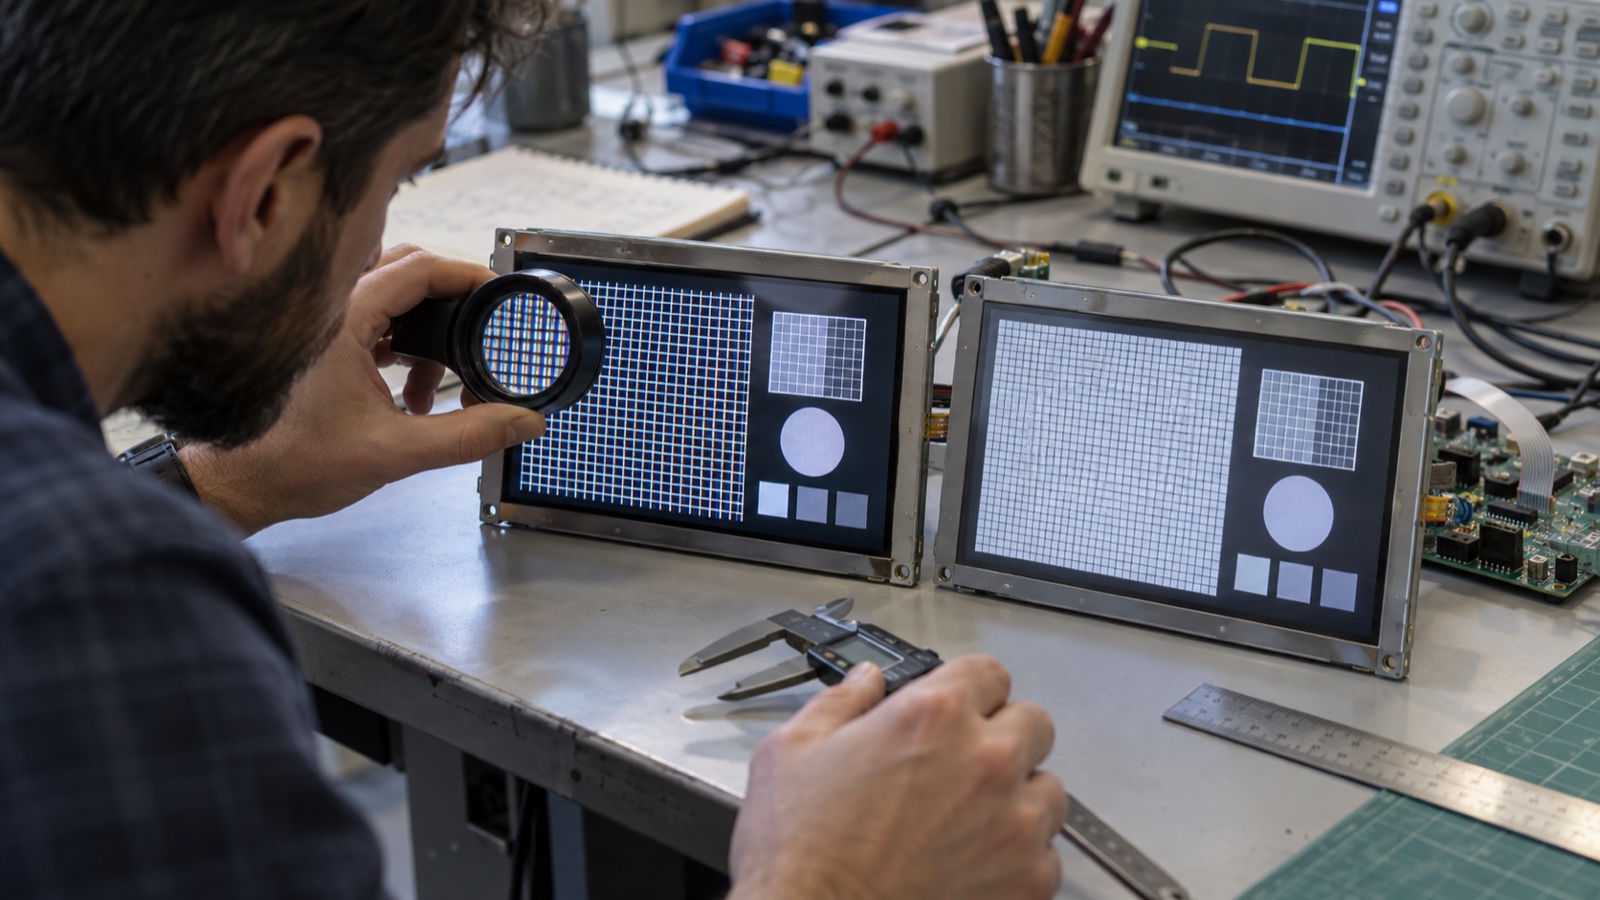
A higher-resolution display can make an embedded product look sharper. It can also increase GPU load, memory traffic, interface bandwidth, boot time, power consumption, and software work without improving the operator’s task.
That is why “use the highest resolution that fits” is a poor selection rule. The useful target is enough pixel density for the intended viewing distance, text size, graphics, and touch interaction—then enough processing margin to render the interface reliably for the life of the product.
Pixel density, usually stated in pixels per inch (PPI), is the bridge between a panel’s pixel count and its physical size. It helps compare formats that sound similar on a datasheet but behave very differently in a real HMI.
Resolution and PPI answer different questions
Resolution is the number of addressable pixels, commonly written as horizontal × vertical. A 1280×800 panel contains the same pixel count whether its diagonal is 7 inches or 10.1 inches.
PPI describes how closely those pixels are packed. It is calculated from the diagonal pixel count divided by the diagonal size:
PPI = √(horizontal pixels² + vertical pixels²) / diagonal inches
For a 10.1-inch 1280×800 display:
PPI = √(1280² + 800²) / 10.1
    ≈ 149.4 PPI
For a 10.1-inch 1920×1200 display, the density rises to about 224.2 PPI. The physical screen is nearly the same size, but each UI element rendered at the same pixel dimensions becomes roughly one-third smaller in each direction.
Useful reference calculations
The table below uses nominal diagonal dimensions. Actual active-area dimensions from the panel drawing should be used for final mechanical and UI work.
| Panel format | Approximate PPI | Typical implication |
|---|---|---|
| 4.3-inch, 480×272 | 128 | Simple controls and large labels |
| 5-inch, 800×480 | 187 | Compact HMI with moderate detail |
| 7-inch, 1024×600 | 169 | General industrial control screen |
| 10.1-inch, 1280×800 | 149 | Comfortable mid-distance dashboard |
| 10.1-inch, 1920×1200 | 224 | Fine graphics or image-rich interface |
| 15.6-inch, 1920×1080 | 141 | Larger viewing distance and more workspace |
These figures do not create a universal ranking. A 141 PPI screen viewed from 700 mm can look cleaner than a 224 PPI screen whose software renders tiny text at 350 mm.
Start with the viewing task, not the panel catalog
Before choosing a resolution, write down how the display will be used:
- Normal and worst-case viewing distance.
- Smallest text or symbol that carries important information.
- Whether the operator is standing still, walking past, or working in vibration.
- Whether gloves, wet fingers, or a stylus are involved.
- Whether the UI shows trends, maps, camera images, schematics, or mainly buttons.
- Whether multiple languages can make labels longer.
- Whether older users or users with corrected vision are common.
An operator reading alarm text from 800 mm needs a different design from a technician inspecting a waveform from 300 mm. The panel cannot compensate for a UI that ignores those conditions.
NASA human-factors guidance treats legibility as a task to verify with representative users, viewing distances, angles, and illumination—not as a result guaranteed by pixel count. That is the right mindset for industrial design as well.
Convert physical UI sizes into pixels
A practical HMI starts with physical dimensions. Once PPI is known, millimeters can be converted to pixels:
pixels = millimeters × PPI / 25.4
At 187 PPI, a 10 mm touch target is about 74 pixels wide. At 128 PPI, the same 10 mm target is about 50 pixels. If the application uses fixed 50-pixel buttons on both panels, the higher-density panel produces a physically smaller target.
This is a common failure during panel upgrades. Engineering replaces an 800×480 display with a higher-resolution part, the software keeps the old pixel dimensions, and controls become too small even though the image looks sharper.
For touch-first products, define buttons and spacing in millimeters or density-independent units. Microsoft’s touch guidance notes that physical target area matters more than raw layout pixels and cites 10×10 mm as a comfortable size for important controls. That is useful context, but the final value must still be validated with the product’s users, gloves, bezel, and mounting angle.
Text sharpness depends on more than PPI
Higher density reduces visible stair-stepping and gives font rendering more samples. It does not automatically create readable text. Legibility also depends on:
- Character height and stroke width in physical units.
- Font design and hinting.
- Foreground/background contrast.
- Anti-aliasing and subpixel assumptions.
- Cover-glass reflections and haze.
- Viewing distance and angle.
- Motion, vibration, and ambient light.
A fine typeface on a glossy, low-contrast display can be harder to read than a simpler font on a lower-density panel. Test the smallest critical label through the production cover lens, not from a desktop screenshot.
The software stack must understand scaling
Desktop and mobile operating systems often provide logical points, density-independent pixels, or scale factors. Small embedded stacks may not. A framebuffer application can map one UI pixel directly to one panel pixel unless the team builds a scaling system.
Before changing density, confirm:
- How the GUI framework calculates logical size.
- Whether bitmap assets exist at suitable resolutions.
- Whether fonts are vector-rendered or pre-rasterized.
- Whether line widths and icons scale consistently.
- Whether screenshots, remote support, and test automation assume a fixed resolution.
- Whether boot logos and recovery screens use the same scaling path.
Apple’s interface guidance makes a useful distinction between logical points and physical pixels: the same logical element may map to different pixel counts on different displays. An embedded GUI does not need to copy Apple’s scale factors, but it benefits from the same separation.
Resolution increases processing and memory work
Frame-buffer size is easy to estimate:
frame-buffer bytes = width × height × bytes per pixel
A 1280×800 RGB888 frame uses about 3.07 MB. A 1920×1200 frame uses about 6.91 MB. Double buffering doubles those numbers before accounting for GPU surfaces, textures, video buffers, and alignment.
Memory bandwidth is larger again because rendering can read and write pixels multiple times. Compositing translucent layers, scaling video, rotating the screen, or applying animation can turn a seemingly modest resolution increase into a major load. On an MCU, external SDRAM bandwidth and bus contention may become the actual limit. On an MPU, thermal and boot-time effects may matter.
The display interface bandwidth calculation method should be applied before a high-resolution panel is approved. Pixel count affects the source, memory, cable, bridge IC, and panel timing together.
Aspect ratio and resolution should be chosen together
Two panels can have similar PPI but very different workspace. A wide 16:9 display suits timelines, camera views, and split panes. A 4:3 or 5:4 format can give more vertical room in a compact machine panel. A square display may fit a rotary control or narrow enclosure better than a widescreen panel.
The right industrial display aspect-ratio selection begins with the content hierarchy. Do not choose a resolution independently and then force the UI into the available shape.
Compare real module choices, not abstract PPI targets
A density target narrows the search, but the module still has to meet interface, brightness, temperature, availability, and mechanical requirements. For example:
- A 5-inch 800×480 TFT format offers relatively high density in a compact area.
- A 10.1-inch 1920×1200 IPS panel supports detailed dashboards and imaging-oriented layouts.
- A 15.6-inch full-HD display option provides a larger physical workspace at a moderate density.
These links are starting points, not substitutes for application testing. Use the active-area drawing, native timing, interface, luminance, and lifecycle data for the exact part number.
A practical selection workflow
1. Define the physical UI
Sketch the smallest critical text, primary touch targets, charts, and status areas in millimeters. Include localization and error states.
2. Set realistic viewing conditions
Record nominal distance, extreme distance, angle, illumination, gloves, and vibration. Photograph or mock up the intended installation.
3. Calculate a PPI range
Estimate the pixels required to render the physical UI cleanly. Use a range rather than a single magic number.
4. Check compute and interface limits
Estimate framebuffer memory, render bandwidth, pixel clock, interface rate, and bridge requirements. Include at least 20–30% system margin where the platform is not already characterized.
5. Build two native-resolution prototypes
Do not compare panels by scaling one desktop screenshot. Run the actual GUI at native resolution on representative hardware.
6. Validate tasks, not opinions
Ask users to read alarms, select controls, interpret trends, and complete common workflows. Record error rate and completion time under the real lighting and distance.
Questions to put on the design review
- What physical size will the smallest critical character have?
- Is UI scaling independent of panel pixels?
- Can the processor sustain the native frame rate with worst-case animation?
- Is enough memory available for buffers and assets?
- Does the interface support native timing with margin?
- Are touch targets still large enough after scaling?
- Will a second-source panel preserve active area and density closely enough?
- Can production inspect the display without confusing higher PPI with better optical quality?
The useful target is sufficient density
PPI is a design input, not a quality score. Select enough density to render the required information cleanly at the intended distance, then stop paying for pixels the user cannot benefit from.
The strongest choice is the panel that keeps text and controls physically usable, fits the content shape, stays within compute and link budgets, and remains available over the product lifecycle. Incorporate those checks into the broader industrial LCD size and resolution requirements rather than approving resolution as an isolated line item.
FAQ
What PPI is good for an embedded HMI?
There is no universal number. Many industrial panels fall roughly between 120 and 220 PPI, but viewing distance, text size, graphics, and scaling determine whether that density is useful.
Is a higher-resolution LCD always sharper?
It can render finer detail, but only when the source assets, font engine, signal path, optics, and viewing distance preserve that detail.
Should UI dimensions be specified in pixels?
Not by themselves. Define critical text and touch sizes in physical or density-independent units, then map them to pixels for each panel.
Does PPI affect interface bandwidth?
Indirectly. Higher PPI often comes from higher resolution at the same size, and higher resolution increases pixel clock, memory traffic, and link bandwidth.
Technical references
- Microsoft guidance on physical touch-target size — explains why physical target area matters more than a fixed pixel count.
- Apple guidance on logical points, pixels, and scale factors — a clear example of separating UI size from physical pixel density.
- NASA human-integration design processes — discusses legibility verification using representative distance, angle, lighting, and tasks.