LCD Response Time: Rise, Fall, Gray-to-Gray, and Temperature Effects
Understand LCD rise, fall, gray-to-gray response time, overdrive, motion artifacts, and why industrial display performance slows at low temperature.
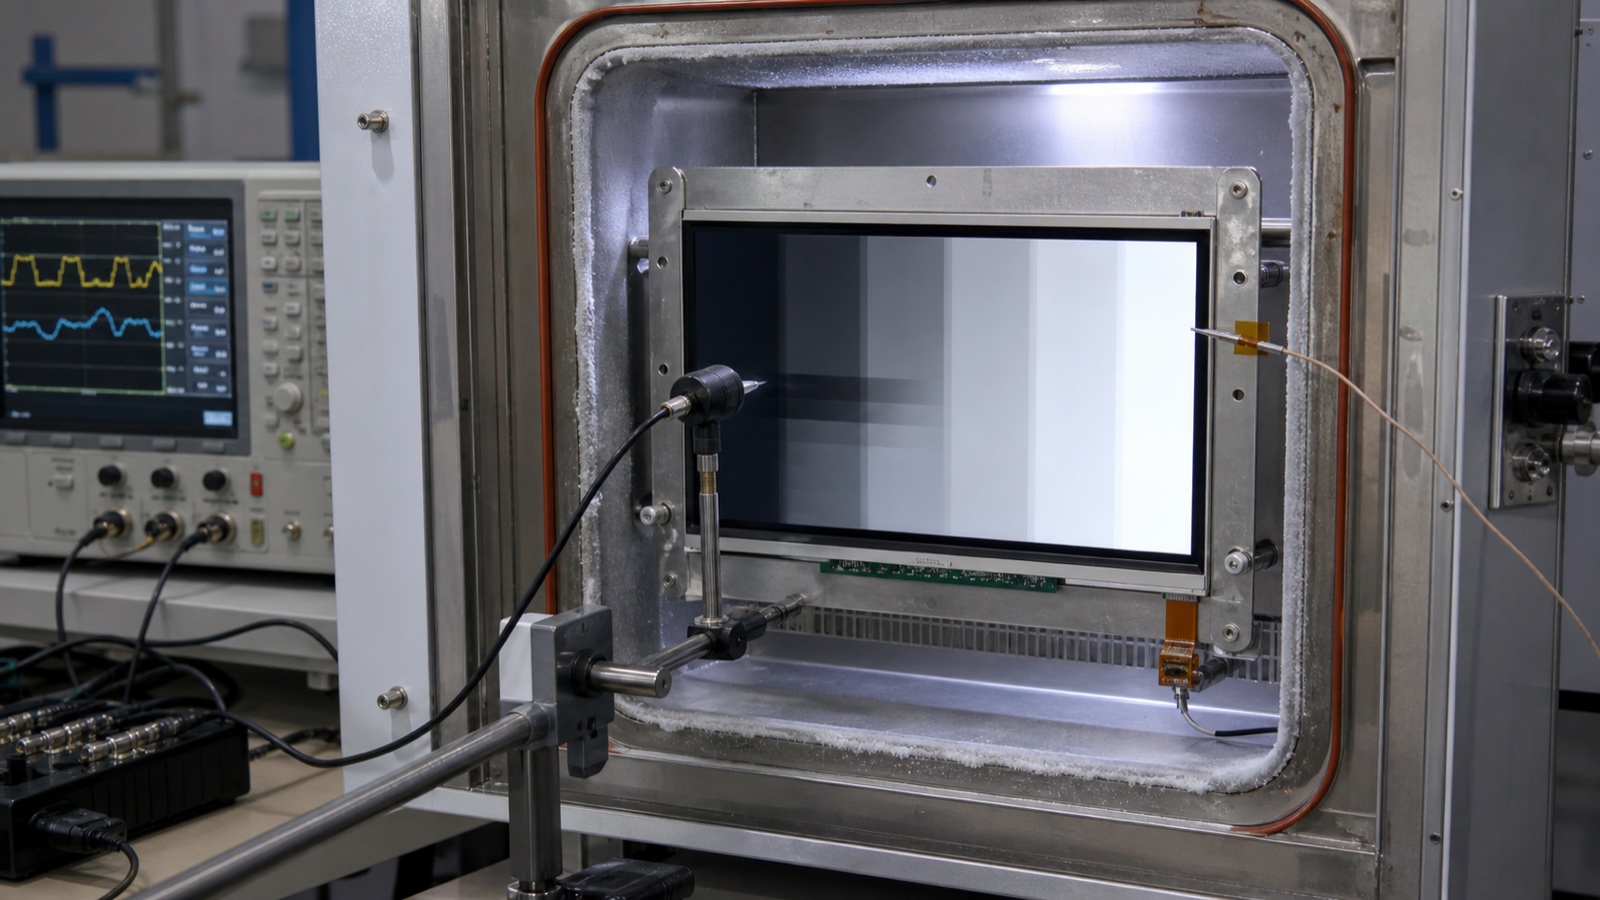
An LCD datasheet that says “response time: 20 ms” appears straightforward. It is not. The number might be black-to-white plus white-to-black at room temperature. It might be one selected gray-to-gray transition with overdrive enabled. It may describe a typical sample rather than a guaranteed limit. None of those conditions predicts how the same panel will look after a cold start at -20°C.
Response time matters whenever pixels must change faster than the information on screen. Slow transitions create trails, blurred edges, delayed grayscale, and temporary mixtures of the old and new frame. In an industrial product, that can affect camera previews, moving maps, scrolling values, trend graphs, and alarm animations.
The right way to review response time is to ask three questions: which transition, measured how, and at what temperature?
What LCD response time actually measures
LCD pixels change optical transmission when an electric field rearranges the liquid-crystal orientation. The electrical command can change quickly; the optical material takes time to reach the new state.
A measurement instrument records luminance versus time after the input level changes. Response time is then calculated between defined percentages of the starting and ending optical levels. Many specifications use 10% and 90% thresholds, but the direction and naming depend on panel mode and the supplier’s convention.
Always read the diagram or footnote. “Rise” may mean luminance increasing on one module and transmission decreasing on another if the panel uses a different normally-white or normally-black definition.
Rise time and fall time are not interchangeable
Datasheets commonly report two values:
- Rise time (Tr): the optical transition in one direction.
- Fall time (Tf): the reverse transition.
Some tables list Tr + Tf as total response time. If rise is 8 ms and fall is 12 ms, the advertised total may be 20 ms. That does not mean every pixel transition finishes in 20 ms, nor that both directions behave equally.
The two times differ because the electric field drives one motion while elastic restoring forces and liquid-crystal viscosity influence the return. Panel mode, voltage, cell gap, material mixture, and drive waveform all affect the balance.
For a simple status HMI, an asymmetric rise and fall may be harmless. For a blinking symbol or rapidly alternating black-and-white pattern, the slower direction can dominate the visible artifact.
Black-white response and gray-to-gray response answer different questions
Traditional black-white-black measurements use the largest luminance transition. Real user interfaces mostly move between intermediate gray and color levels.
Gray-to-gray (GtG) response measures transitions among those intermediate states. A full characterization is a matrix: each starting gray level is tested against multiple destination levels. One panel may complete a large dark-to-light change quickly and still have a slow dark-gray-to-slightly-lighter-gray transition.
This matters in practical content:
- Dark theme menus use many near-black transitions.
- Camera feeds contain continuous midtone changes.
- Trend graphs move colored lines over gray backgrounds.
- Anti-aliased text changes edge pixels through several gray levels.
- Night mode can expose slow dark transitions that a white test screen misses.
A single “5 ms GtG” value may be the fastest, average, or otherwise selected transition. Ask whether the supplier can provide the GtG matrix, worst-case transition, test temperature, and overdrive setting.
Response time is not refresh rate
Refresh rate describes how often the system sends a new frame. At 60 Hz, one frame lasts about:
1 / 60 second ≈ 16.7 ms
Pixel response time describes how quickly the optical output moves toward its new value. The two interact, but they are not direct conversions.
If a transition takes longer than one frame, the pixel may still be changing when the next frame arrives. Even if response is faster than 16.7 ms, motion can still look blurred because an LCD normally holds each frame continuously until the next one. The eye tracks moving content during that hold period, creating sample-and-hold motion blur that a faster pixel response cannot remove entirely.
Other delays also sit outside the LCD material:
- Touch sampling and filtering.
- Application processing.
- Rendering and frame buffering.
- Interface transmission.
- Display controller scanout.
- Backlight synchronization.
Do not use panel response time as a synonym for touch latency or end-to-end interface latency.
Overdrive can make one number faster and the image worse
LCD overdrive briefly applies a stronger drive value so the liquid crystal reaches the target faster. Used well, it reduces slow GtG transitions. Used too aggressively, it overshoots the target and creates bright or dark halos known as inverse ghosting.
Overdrive performance depends on both the starting and destination levels. It can also depend on temperature because a waveform tuned at 25°C may push a warmer, faster cell too far or fail to accelerate a cold, slower cell enough.
When overdrive is present, test:
- Fast and slow GtG transitions.
- Overshoot and undershoot magnitude.
- Dark and light UI themes.
- Cold start, stabilized cold operation, room temperature, and hot operation.
- Production firmware settings, not only a supplier demo board.
If the display controller changes with a second-source panel, the original overdrive table may no longer be appropriate.
Why LCD response slows at low temperature
Liquid-crystal rotational viscosity rises as temperature falls. The molecules respond more slowly to the applied field and restoring forces, so optical transitions take longer. Elastic constants and birefringence can also change.
Research from the University of Central Florida measured commercial liquid-crystal mixtures from -20°C to 60°C and examined how rotational viscosity and elastic constants affect low-temperature response. The practical conclusion for product teams is simple: a room-temperature response-time value should not be extrapolated to the cold end of the operating range.
What users may see after a cold soak includes:
- Trails behind moving objects.
- Smearing during menu changes.
- Delayed dark-to-light or light-to-dark transitions.
- Temporary loss of shadow detail.
- A display that is technically on but visually sluggish.
- Gradual improvement as the panel warms from its own backlight and electronics.
This behavior does not automatically mean the module is damaged. The acceptance question is whether the UI remains usable at the specified temperature and whether recovery meets the product requirement.
Cold start is more revealing than placing a warm screen in a chamber
A common test mistake is powering the display at room temperature and then lowering the chamber setpoint. Internal heat and slow thermal equalization can keep the LCD warmer than the air. The result does not represent a product that has been parked, stored, or left unpowered overnight.
A better cold-start sequence is:
- Power the complete product off.
- Soak it long enough for the display assembly to approach the target temperature.
- Record LCD surface or frame temperature, not only chamber air.
- Power on at temperature using production firmware.
- Observe initialization, backlight, first image, and moving content immediately.
- Measure response at defined intervals as the product self-heats.
For environmental planning, combine this procedure with wide-temperature display qualification and cold-start IPS display testing. Both the LCD and the surrounding materials need to be evaluated in the final assembly.
High temperature is not simply “faster is better”
Response generally becomes faster as the liquid-crystal viscosity falls with increasing temperature, within the intended operating range. That does not mean high temperature is beneficial overall.
At elevated temperature:
- Overdrive may produce more overshoot.
- Black level, gamma, and color can shift.
- Backlight output and lifetime margin can decline.
- Polarizers and adhesives see greater stress.
- Enclosure temperature may exceed the panel’s rating under solar load.
The response-time result must therefore be reviewed together with image stability and reliability. High-brightness backlight thermal design is particularly relevant when backlight power warms a sealed outdoor display.
IPS, TN, and VA do not have one fixed speed ranking
TN earned a reputation for fast transitions, while early IPS and VA implementations were slower. Modern modules use different liquid-crystal mixtures, cell gaps, driving methods, and overdrive algorithms, so technology labels alone do not predict the exact response matrix.
Broad tendencies remain useful:
- TN can provide fast transitions but has more limited viewing-angle stability.
- IPS offers strong viewing-angle and color behavior, with response depending heavily on the module and drive.
- VA provides strong on-axis black but can show slow dark transitions in some implementations.
For an embedded product, choose from measured application behavior rather than a generic ranking. The comparison of IPS, TN, and VA response trade-offs provides the wider technology context.
How to measure LCD response time
A credible lab setup needs a fast optical sensor, controlled test patterns, synchronized data capture, stable temperature, and documented drive settings.
Define the transition
State the starting and ending digital levels, pixel format, color channel or neutral gray, and whether overdrive is active. “Response time” without a transition pair is incomplete.
Record the full optical waveform
Do not store only the calculated millisecond value. The waveform reveals overshoot, undershoot, ringing, delayed settling, and multi-stage behavior.
Use consistent percentage thresholds
Identify whether the calculation uses 10–90%, 90–10%, or another definition. Use the same convention when comparing candidates.
Control temperature at the display
Measure the module or panel temperature near the active area. Chamber air, internal electronics, and backlight self-heating can differ significantly.
Test several positions and samples
Center response may not reveal uniformity or cell-gap variation. Compare multiple samples and, when the application justifies it, multiple screen positions.
Use the final timing and firmware
Pixel format, refresh timing, overdrive tables, and display initialization should match production. A supplier evaluation kit may not reproduce the final system.
The same discipline used for TFT LCD datasheet timing review should be applied to optical response: capture the definition, conditions, and minimum/maximum limits rather than copying one typical figure.
Why a phone camera is not a response-time instrument
High-frame-rate video can reveal gross smearing and is useful for side-by-side demonstrations. It is not a substitute for a photodiode or fast luminance sensor.
Camera exposure duration, rolling shutter, automatic gain, tone mapping, frame cadence, and display-camera synchronization can create or hide trails. If video is used:
- Lock exposure, focus, white balance, and frame rate.
- Use identical geometry and content.
- Include a timing reference.
- Treat the result as visual evidence, not a calibrated millisecond measurement.
For product approval, combine instrument data with the actual UI task. The instrument explains the transition; the user test explains whether it matters.
Match acceptance criteria to the application
Not every product needs gaming-monitor response. Over-specifying speed can restrict supply or increase cost without improving the user experience.
| Application | Response-time concern |
|---|---|
| Static status panel | Cold-start legibility and clean page changes |
| Industrial trends | Trails on moving lines and scrolling history |
| Camera preview | Slow GtG transitions and frame-to-frame smearing |
| Vehicle display | Low-temperature response and rapidly changing warnings |
| Medical or inspection UI | Stable grayscale transitions without overshoot |
| Outdoor kiosk | Cold soak, thermal recovery, and readable animations |
Define the slowest acceptable transition at the required temperature, plus any overshoot limit. If motion is not central to the product, prioritize legibility and predictable behavior over the smallest headline number.
Questions to ask the display supplier
- Does the response-time figure represent Tr, Tf, Tr+Tf, or GtG?
- Which gray levels and percentage thresholds were used?
- Is the number typical, average, maximum, or worst-case?
- Was overdrive enabled, and who owns its lookup table?
- What are the results at minimum and maximum operating temperature?
- Is a complete GtG matrix available?
- What overshoot or undershoot limits apply?
- Does the specification cover the exact panel and controller revision being supplied?
A supplier who cannot answer every question may still offer a suitable module, but the missing data becomes part of your validation work.
What belongs in the qualification report
Never approve an LCD from one room-temperature response-time number. Verify the transition type, measurement thresholds, overdrive state, sample variation, and temperature. Then test the real UI immediately after cold startup and after thermal stabilization.
The best display is not necessarily the one with the fastest advertised GtG value. It is the one whose slowest relevant transition remains acceptable across the product’s operating range without objectionable overshoot, blur, or delayed recovery.
FAQ
Is lower LCD response time always better?
Lower is generally helpful for motion, but a fast number achieved through aggressive overdrive can create inverse ghosting. Speed must be evaluated with overshoot, temperature, and the actual gray transitions used by the UI.
Is 20 ms response time acceptable for an industrial display?
Often yes for menus, controls, status screens, and moderate trend movement. It may be unsuitable for fast camera feeds or motion-critical content, especially if 20 ms is only a room-temperature typical value and cold response is much slower.
What is the difference between GtG and Tr+Tf?
GtG measures transitions between intermediate gray levels. Tr+Tf usually combines two opposite large-signal transitions. They use different test content and should not be compared as equivalent specifications.
Why does an LCD smear when it is cold?
Liquid-crystal rotational viscosity increases as temperature falls, slowing optical transitions. The screen can remain electrically functional while moving content becomes visibly sluggish.
Does a 60 Hz display need response time below 16.7 ms?
A response longer than one 60 Hz frame can cause transitions to overlap subsequent frames, but a value below 16.7 ms does not guarantee perfect motion. GtG variation, overdrive, sample-and-hold blur, and the rest of the display pipeline still matter.
Technical references
- Low temperature effects on the response time of liquid crystal displays — primary research on rotational viscosity, elastic constants, and LCD response from -20°C to 60°C.
- Densitron TFT LCD module optical specification — a manufacturer example of defined rise/fall and optical measurement conditions.