Color Gamut, Color Depth, and Delta E for Embedded Displays
A practical guide to display color gamut, coverage, 6-bit/8-bit/10-bit depth, FRC, Delta E formulas, calibration, and embedded HMI testing.
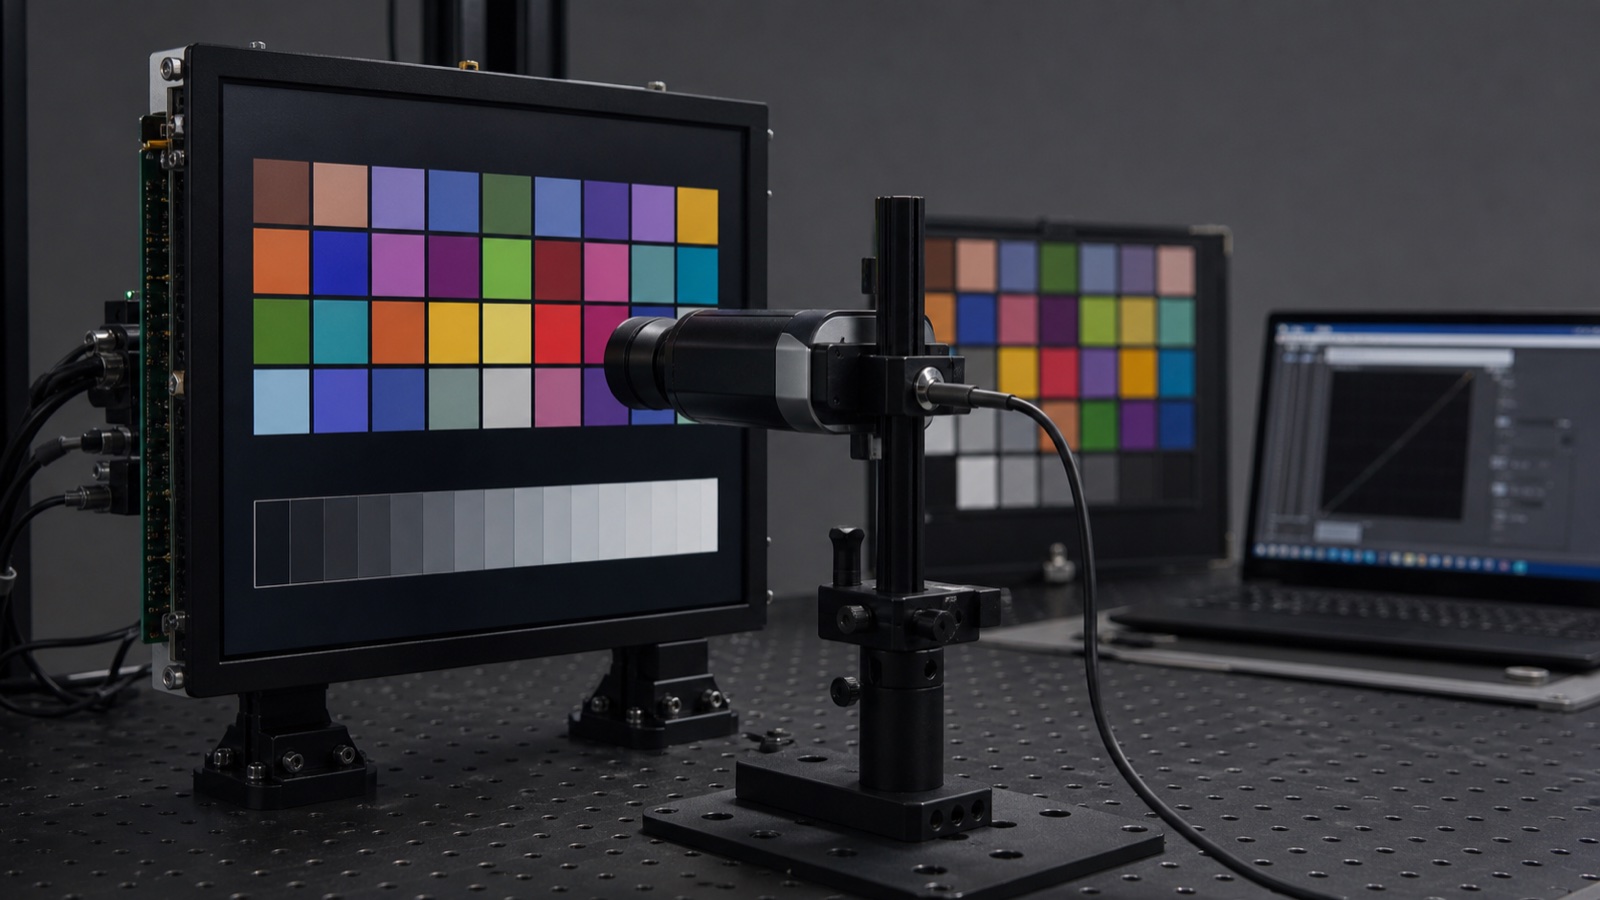
Color discussions around embedded displays often collapse three different questions into one.
“90% gamut” asks how large a range of colors the display can produce. “8-bit” describes how many digital levels the pipeline can address. “Delta E below 2” describes a measured difference between a target and a result under a particular formula and test condition.
None of those numbers proves the other two. A display can have a wide gamut and inaccurate colors. It can accept 10-bit input while the panel behaves like 8-bit. It can measure a low average Delta E at the center and still have visible uniformity or off-axis problems.
For an industrial HMI, the goal is not to collect the largest color specifications. It is to decide which color behavior the user actually needs, then verify the entire pipeline from image asset to emitted light.
Color gamut describes the boundary, not accuracy
A display creates color from red, green, and blue primaries. Plot their chromaticity coordinates on a defined color diagram and they form a triangle. That triangle is the display’s approximate gamut: the set of colors it can reproduce under the stated condition.
The result must be compared with a named reference space, such as:
- sRGB for common computer graphics and web assets.
- ITU-R BT.709 for HDTV production colorimetry.
- DCI-P3 or Display P3 for wider-gamut content.
- Adobe RGB for some photography and imaging workflows.
A percentage without its reference is incomplete. “90% color gamut” could mean 90% of DCI-P3, 90% of Adobe RGB, an NTSC area ratio, or a supplier-specific calculation.
For many industrial interfaces, reliable sRGB-class output is more useful than a wider but unmanaged gamut. Alarm red should remain the intended alarm red; making it more saturated is not automatically an improvement.
Gamut coverage and gamut area are different
These terms are frequently mixed in product literature.
Gamut coverage measures how much of the target color space lies inside the display’s gamut. It is based on the intersection between the two regions. Coverage cannot exceed 100% of the target.
Gamut area ratio compares the size of the display triangle with the size of the reference triangle. A display can report 110% area while still missing part of the target if its primaries extend in different directions.
Imagine two triangles of similar size that do not align. The display triangle may be large, but one target corner remains outside it. Area sounds impressive; coverage reveals the missing colors.
When comparing modules, ask:
- Which reference space is used?
- Is the figure area ratio or coverage?
- Which chromaticity diagram and calculation method are used?
- Are values typical or minimum?
- At what white point, backlight level, and temperature?
- Is the result for the bare module or final bonded assembly?
VESA’s DisplayHDR material is a useful example of explicit terminology: it separates gamut coverage from color-accuracy testing and specifies the reference and test conditions. An embedded LCD does not need HDR certification, but its specification should be equally clear about what the percentage represents.
Why “72% NTSC” is easy to misuse
Many TFT LCD datasheets still quote color gamut as a percentage of the 1953 NTSC triangle. This is often an area comparison rather than target-space coverage. It should not be casually rewritten as an exact sRGB percentage.
The two reference triangles use different primary coordinates. Similar areas do not guarantee the same boundary or coverage. Backlight spectrum, color filters, and the measurement method also affect the result.
If the product uses sRGB assets, request sRGB coverage directly or obtain the measured primary coordinates and calculate coverage consistently. Do not approve color performance from an NTSC percentage copied into a sales table.
Color depth is the number of addressable levels
Color depth describes how many digital code values are available per channel.
| Nominal depth | Levels per RGB channel | Possible RGB combinations |
|---|---|---|
| 6-bit | 64 | 262,144 |
| 8-bit | 256 | 16.7 million |
| 10-bit | 1,024 | 1.07 billion |
More levels reduce visible banding in smooth gradients and give calibration or tone-mapping algorithms more room to work. They do not expand the gamut boundary. A 10-bit display with narrow primaries still has a narrow gamut; it simply has more steps inside that gamut.
Likewise, 10-bit input does not guarantee 10-bit native panel behavior. The source, GPU or MCU, framebuffer, interface, timing controller, panel driver, and LCD must all preserve the required precision.
Native bit depth and FRC need to be stated honestly
Frame rate control (FRC) alternates neighboring values over time so the eye perceives an intermediate level. A 6-bit panel with FRC may be marketed as displaying 16.7 million colors, and an 8-bit panel with FRC may accept a 10-bit pipeline.
FRC can work well. It is not identical to native bit depth, and its artifacts depend on implementation and content. Possible issues include:
- Temporal noise in dark grays.
- Pattern visibility at low brightness.
- Interaction with camera shutters.
- Color or luminance instability in small areas.
- Different behavior at low refresh rates or temperature.
Ask suppliers to state native driver depth, FRC method, accepted input depth, and output behavior separately. “Supports 10-bit” may describe only the interface.
The narrowest stage limits the complete color pipeline
An embedded display system can lose precision before pixels reach the LCD. Review every stage:
- Content: Are assets tagged or created for a defined color space?
- Rendering: Does the application blend and render at sufficient precision?
- Framebuffer: Is the output RGB565, RGB888, 8-bit plus dithering, or 10-bit?
- Interface: Does the chosen LVDS, MIPI DSI, eDP, or HDMI configuration carry the intended depth?
- Display controller: Are gamma tables, range settings, and dither modes controlled?
- Panel: What is the native driver depth and actual optical performance?
- Backlight and filters: Do their spectra produce the required primaries and white point?
An 8-bit IPS panel can look excellent in a well-controlled sRGB pipeline. A nominal 10-bit module can show banding if an MCU outputs RGB565 or if a gradient asset was pre-quantized.
The industrial LCD approval checklist should therefore include pixel format and software configuration, not only the panel’s marketing depth.
Delta E measures difference, not “quality” by itself
Delta E is a numerical color difference between two points in a defined color space using a defined formula. It can compare measured output with a target or compare one sample with a golden unit.
There is more than one Delta E formula:
- ΔE*ab, often called CIE76.
- CIE94.
- CIEDE2000, written ΔE00.
- ΔEITP or ΔETP for HDR and wide-color applications.
The same pair of colors can produce different numerical values under different formulas. A specification that says “Delta E <2” without naming the formula, test patches, instrument, white point, luminance, and aggregation method is incomplete.
The CIEDE2000 formula was created because equal geometric distances in earlier color spaces do not always correspond to equal perceived differences. CIE’s current standard defines the formula and its corrections. That makes ΔE00 a useful choice for many controlled comparisons, but it still does not create a universal pass/fail threshold for every industrial task.
Average Delta E can hide the color that matters
Suppose 23 patches measure near the target and one alarm-red patch is visibly wrong. The average may still look excellent. For an HMI, the maximum error or specific critical-color error can matter more than the average.
Record at least:
- Formula used.
- Patch set and digital values.
- Average, maximum, and selected critical colors.
- White point and luminance.
- Gamma or tone-response condition.
- Instrument and calibration date.
- Panel warm-up, temperature, and backlight setting.
- Measurement position and viewing geometry.
For production matching, compare several samples and lots. For calibrated products, verify before and after the correction is applied. A low Delta E achieved through one unit’s custom profile does not prove that uncalibrated production units will match.
Delta E does not describe several visible problems
A center-point color-accuracy result can be good while the display still has:
- Brightness or chromaticity non-uniformity.
- Gray tracking errors.
- Black crush or weak contrast.
- Banding from limited bit depth.
- Viewing-angle color shift.
- Backlight drift with temperature or time.
- Reflections that change perceived saturation.
- FRC or PWM temporal artifacts.
This is why IPS display color consistency checks begin with grayscale, multiple samples, and the production UI rather than one average color score.
White point, gamma, and luminance must be controlled
Color coordinates change meaning when the test state changes. A display measured at full backlight may not behave identically at its normal operating level. Automatic color or contrast enhancement can also move results from one test pattern to another.
For repeatable measurements:
- Set a target white point appropriate to the workflow, often D65 for sRGB/BT.709-oriented content.
- Fix backlight level and disable adaptive processing.
- Warm the display for a defined time.
- Measure tone response, not only the primaries.
- Keep ambient light and viewing geometry controlled.
- Repeat at application-relevant dimming levels and temperatures.
ITU-R BT.709 defines reference colorimetric parameters for HDTV production. If an embedded device displays BT.709 or sRGB-oriented content, its pipeline should be configured intentionally rather than assuming every “RGB” mode behaves the same.
The instrument must match the display technology
A tristimulus colorimeter is fast and practical for production, but its accuracy depends on how well its filters and correction matrix match the display’s spectral power distribution. A spectroradiometer measures the spectrum more directly and can be used to characterize a reference sample or build a correction for the production colorimeter.
Backlight changes matter. A new LED bin, phosphor formulation, quantum-dot film, cover lens, or optical adhesive can alter the spectrum seen by the instrument. If the supplier changes those materials, an old correction matrix or golden sample may no longer be valid.
Good practice for color-sensitive production is to:
- Characterize representative samples with a suitable reference instrument.
- Correlate the faster production instrument to that display type.
- Control measurement geometry and warm-up.
- Recheck correlation after optical-material or backlight changes.
- Keep raw x/y/Y or spectral records in addition to final pass/fail results.
How much color performance does an embedded HMI need?
Requirements should follow the user task.
Basic industrial controls
Prioritize stable grayscale, clear alarm colors, adequate contrast, and sample consistency. A controlled sRGB-class pipeline and visual golden sample may be more useful than a strict professional-monitor Delta E target.
Brand-sensitive indoor products
Measure key brand colors, white point, gamma, and unit-to-unit variation. Define average and maximum error only after comparing values with actual visual acceptance.
Medical, inspection, and imaging systems
Define the viewing environment, calibration method, patch set, luminance states, uniformity, drift, and recalibration interval. Application-specific regulations or standards may override general display guidance.
Video or wide-gamut interfaces
Confirm DCI-P3 or other target coverage, 10-bit pipeline behavior, tone mapping, and FRC artifacts. Wide gamut without color management can oversaturate ordinary sRGB assets.
The 10.1-inch high-resolution IPS panel format can be appropriate for medical-style or inspection HMIs, but resolution and panel type alone do not establish color accuracy. The module must be measured in the final system.
A practical color validation workflow
Step 1: Define the target
Name the color space, white point, luminance, gamma or transfer behavior, bit depth, and critical colors. Avoid “good color” or “wide gamut” as standalone requirements.
Step 2: Freeze the pipeline
Record source assets, framebuffer format, operating-system color settings, display initialization, gamma tables, interface depth, and FRC or dithering configuration.
Step 3: Measure several samples
Use at least enough modules to reveal unit-to-unit variation. Include the final touch sensor, bonding, and cover glass when they are part of the shipped product.
Step 4: Check more than center accuracy
Measure white, grayscale, primaries, secondary colors, critical UI colors, uniformity, and viewing angle. Repeat at normal and low brightness if the product dims substantially.
Step 5: Test the real UI
Color patches make results comparable. The actual interface reveals whether alarms, disabled states, gradients, photographs, and small colored elements remain usable.
Step 6: Build production control
Define the golden sample, instrument correlation, limits, sampling plan, lot traceability, and PCN triggers for backlight, polarizer, color filter, adhesive, or cover lens changes.
Supplier questions worth asking
- Which color space is the gamut percentage referenced to?
- Is the number gamut coverage or gamut area?
- Are primary coordinates and white-point tolerances available?
- What is the panel’s native bit depth?
- Is FRC used, and at which stage?
- What input depth does the interface accept?
- Which Delta E formula, patches, and aggregation are used?
- Are color values typical or guaranteed?
- How are LED bins and optical materials controlled?
- Which changes require a product-change notice?
These answers help distinguish a real color specification from a stack of unrelated marketing numbers.
A sensible color specification
Treat gamut, color depth, and Delta E as separate layers of the same system.
Gamut defines the reachable color boundary. Bit depth defines the number of digital steps available within the pipeline. Delta E compares measured results with a target under a named formula and condition. None of them replaces checks for gamma, uniformity, viewing angle, temperature, or production variation.
For most embedded products, a well-controlled, repeatable color pipeline is more valuable than the widest advertised gamut. If the application truly depends on color judgment, document the target and measurement process with the same discipline used for electrical and mechanical qualification. The broader IPS versus OLED color and lifetime trade-offs can help choose the display technology before calibration requirements are finalized.
FAQ
Is 100% sRGB the same as 100% NTSC?
No. They are different reference gamuts with different primary coordinates. A percentage may also describe area rather than coverage. Always confirm the reference space and calculation method.
Does a 10-bit display have a wider color gamut?
Not necessarily. Ten-bit depth provides more code levels. Gamut depends on the primary colors created by the backlight, color filters, and panel. A display can be 10-bit and narrow-gamut, or 8-bit and relatively wide-gamut.
Is 8-bit plus FRC equal to native 10-bit?
It can approximate additional levels effectively, but it is not the same implementation. FRC may introduce temporal artifacts and should be tested with dark gradients, low brightness, camera use, and the production refresh rate.
What is a good Delta E for an industrial display?
There is no universal value. The answer depends on the Delta E formula, colors tested, viewing environment, user task, instrument, and whether the limit applies to average or maximum error. Define acceptance from application needs and visual correlation.
Why do colors change after adding cover glass?
Cover glass, touch sensors, adhesives, coatings, and optical bonding can change transmission, reflection, and sometimes spectral balance. Color-sensitive products should be measured through the final optical stack.
Technical references
- ISO/CIE 11664-6 CIEDE2000 color-difference formula — the current CIE definition of the CIEDE2000 method.
- ITU-R BT.709 colorimetric parameters — the in-force recommendation for HDTV production parameters.
- VESA DisplayHDR color and accuracy criteria — an explicit example of gamut coverage, color accuracy, bit depth, and luminance being tested separately.